1. Introduction
emote sensing dataset offers unique possibilities for spatial and temporal characterization of the changes. The fundamental requirement is the availability of different dates of satellite imagery which permits continuous monitoring of change and environmental developments over time (Lu et al., 2004; Nasr and Helmy, 2009; Ahmad, 2012b; . RS sensor is a key device that captures data about an object or scene remotely. Since objects have their unique spectral features, they can be identified from RS imagery according to their unique spectral characteristics (Xie, 2008; Ahmad and Shafique, 2013; . A good case in vegetation mapping by using RS technology is the spectral radiances in the red and near-infrared (NIR) regions, in addition to others . The radiances in these regions could be incorporated into the spectral vegetation indices (VI) that are directly related to the intercepted fraction of photosynthetically active radiation (Asrar et al., 1984;Galio et al., 1985;Xie, 2008; Ahmad and Shafique, 2013; . The spectral signatures of photosynthetically and nonphotosynthetically active vegetation showed obvious difference and could be utilized to estimate forage quantity and quality of grass prairie (Beeri et al., 2007;Xie, 2008;.
RS is the technology that can give an unbiased view of large areas, with spatially explicit information distribution and time repetition, and has thus been widely used to estimate crop yield and offers great potential for monitoring production, yet the uncertainties associated with large-scale crop yield (Quarmby et al., 1993;Báez-González et al., 2002;Doraiswamy et al., 2003;Ruecker et al., 2007;Ahmad and Shafique, 2013a) estimates are rarely addressed .
RS dataset of better resolution at different time interval helps in analyzing the rate of changes as well as the causal factors or drivers of changes (Dai and Khorram, 1999;Ramachandra and Kumar, 2004;Ahmad, 2012b). Hence, it has a significant role in planning at different spatial and temporal scales. Change detection in agricultural planning helped in enhancing the capacity of local governments to implement sound environmental management (Prenzel and Treitz, 2004;Ramachandra and Kumar, 2004;Ahmad, 2012b). This involves development of spatial and temporal database and analysis techniques. Efficiency of the techniques depends on several factors such as classification schemes, modelling, spatial and (Ramachandra and Kumar, 2004;Ahmad, 2012b). Natural resources in the arid environment are declining in productivity and require special attention, and if the ecological condition persists, a further decline in resources may result in land degradation (Babu et al., 2011).
Preprocessing of satellite datasets prior to vegetation extraction is essential to remove noise (Schowengerdt, 1983; and increase the interpretability of image data (Campbell, 1987;Schowengerdt, 2006;. The ideal result of image preprocessing is that all images after image preprocessing should appear as if they were acquired from the same sensor (Hall et al., 1991;Xie, 2008;. Image preprocessing commonly comprises a series of operations, including but not limited to bad lines replacement, radiometric correction, geometric correction, image enhancement and masking although variations may exist for images acquired by different sensors (Schowengerdt, 1983;Campbell, 1987;Xie, 2008;. Long-term observations of remotely sensed vegetation dynamics have held an increasingly prominent role in the study of terrestrial ecology (Budde et al., 2004;Prasad et al., 2007;Ouyang et al., 2012;Ahmad, 2012a).
The development of long-term data records from multi-satellites/multi-sensors is a key requirement to improve our understanding of natural and humaninduced changes on the Earth and their implications (NRC, 2007; Miura et al., 2008;Ahmad, 2012c). A major limitation of such studies is the limited availability of sufficiently consistent data derived from long-term RS (Ouyang et al., 2012;Ahmad, 2012a;. The benefit obtained from a RS sensor, largely depends on its spectral resolution (Jensen, 2005;Ahmad, 2012a;, which determines the sensor's capability to resolve spectral features of land surfaces (Fontana, 2009;Ahmad, 2012a;. One of the key factors in assessing vegetation dynamics and its response to climate change is the ability to make frequent and consistent observations (Thomas and Leason, 2005;Ouyang et al., 2012;Ahmad, 2012a;.
Landsat ETM+ has shown great potential in agricultural mapping and monitoring due to its advantages over traditional procedures in terms of cost effectiveness and timeliness in availability of information over larger areas (Murthy et al., 1998;Rahman et al., 2004;Adia and Rabiu, 2008;Ahmad, 2012d) and ingredient the temporal dependence of multi-temporal image data to identify the changing pattern of vegetation cover and consequently enhance the interpretation capabilities. Integration of multi-sensor and multitemporal satellite data effectively improves the temporal attribute and the accuracy of results (Adia and Rabiu, 2008;Ahmad, 2012d).
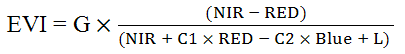
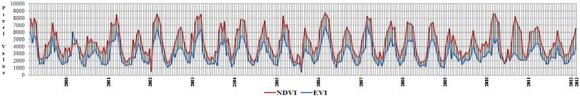
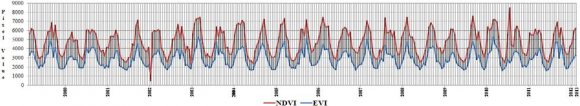
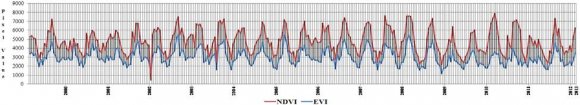
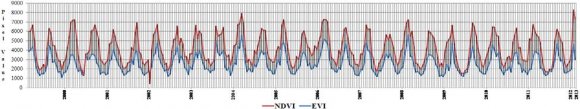
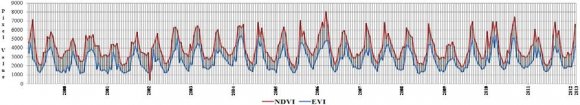
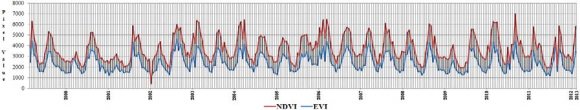
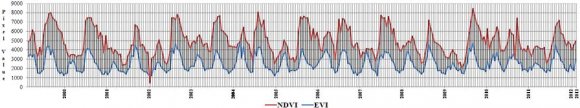
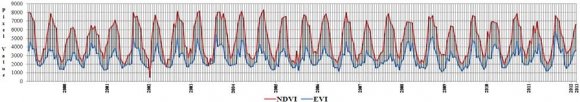
The MODIS (Terra) NDVI (Rouse et al., 1973) and EVI (Liu and Huete, 1995;Justice et al., 1998;Huete et al., 1999) datasets provide unique opportunities for monitoring terrestrial vegetation conditions at regional and global scales (Yang et al., 1997;Piao et al., 2006;Ahmad, 2012a;, and has widely been used in research areas of net primary production (Potter et al., 1993;Paruelo et al., 1997 Multi-year time series of EVI/NDVI can reliably measure yearly-changes in the timing of the availability of high-quality vegetation. The biological significance of NDVI indices should be assessed in various habitat types before they can be widely used in ecological studies (Hamel et al., 2009;Ahmad, 2012a). The premise is that the NDVI is an indicator of vegetation health, because degradation of ecosystem vegetation, or a decrease in green, would be reflected in a decrease in NDVI value (Hamel et al., 2009;Meneses-Tovar, 2011;Ahmad, 2012a). The NDVI has the potential ability to signal the vegetation features of different eco-regions and provides valuable information as a RS tool in studying vegetation phenology cycles at a regional scale (Guo, 2003;Ahmad, 2012a).
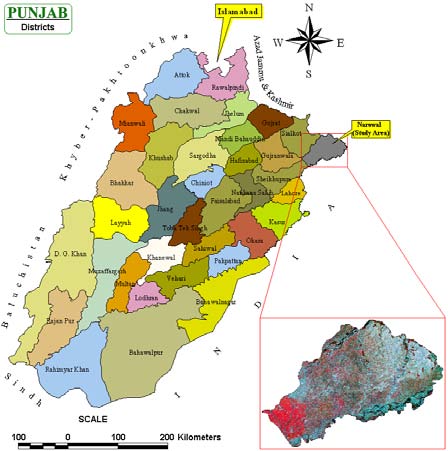
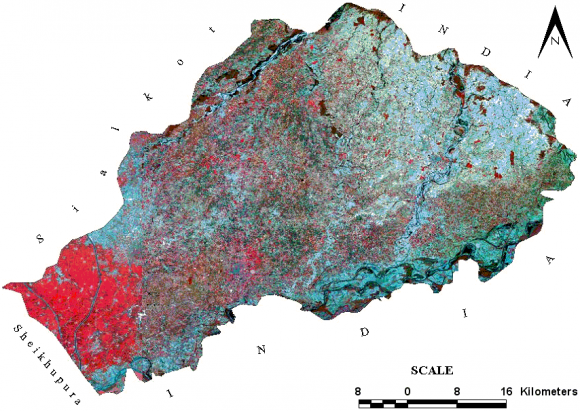
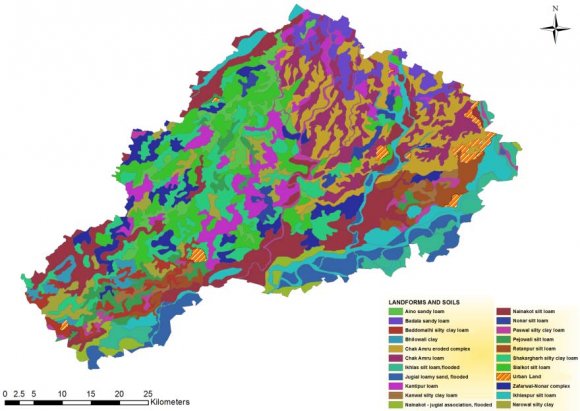
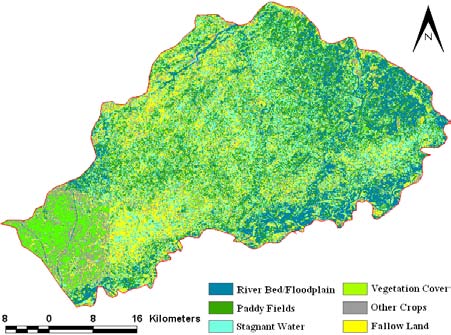
The NDVI is established to be highly correlated to green-leaf density and can be viewed as a proxy for above-ground biomass (Tucker and Sellers, 1986;Ahmad, 2012e). The NDVI is the most commonly used index of greenness derived from multispectral RS data (USGS, 2010; Ahmad, 2012e), and is used in several studies on vegetation, since it has been proven to be positively correlated with density of green matter (Townshend et al., 1991;Huete et al., 1997;Huete et al., 2002;Debien et al., 2010;Ahmad, 2012e). The NDVI provides useful information for detecting and interpreting vegetation land cover it has been widely used in RS studies (Dorman and Sellers, 1989;Myneni and Asrar, 1994;Gao, 1996 The District Narowal (Figure 1; 2) lies in the Punjab province of Pakistan from 31° 55' to 32° 30' North latitude and 74° 35' to 75° 21' East longitude. The district is bounded on the north-west by Sialkot district, on the north by Jammu State, on the east by Gurdaspur district (India) and on the south by Amritsar district (India) and Sheikhupura district (GOP, 2000). The general aspect of the district is a plain slopping down from the uplands at the base of the Himalayas to the level country to the south-west (Figure 3), and the general altitude is 266 meters above sea level (GOP, 2000;Shah, 2007).
Bounded on the south-east by the river Ravi, the district is fringed on the either side by a line of fresh alluvial soil, about which rise the low banks that form the limits of the river bed. At about a distance of 24 km from Ravi, another stream, the Dake which rises in the Jammu hills traverses the district. The district is practically a level plain. Its north-eastern boundary is at a distance of about 32 km from the outer line of the Himalayas, but the foot-hills stop short of the district and its surface is level plain broken only by the river Ravi, by more than drainage channels. The general slope as indicated by the lines of drainage is from north-east to south-west (GOP, 2000). inclusion into a categorization algorithm as an input feature (Ozdogan et al., 2010). Using dataset from multiple time periods, the prejudice procedure is based on the different spectral responses of crops according to their phenological evolution (Abuzar et al., 2001;Ozdogan et al., 2010). A number of studies have established that using spectral information from two successive seasons in a crop-year is sufficient to identify the paddy/rice fields. However, for each season, the estimates require multiple datasets (Abuzar et al., 2001;Ozdogan et al., 2006;Ozdogan et al., 2010). This is because single-date analysis in visible cropping intensity often does not take into account planting dates that vary from year to year. Therefore, multi-temporal analysis has greater potential to define paddy/rice fields (Akbari et al., 2006;Ozdogan et al., 2010). Eventually, the results of classification are restricted upon the temporal and spatial variability of the spectral signature of the land cover type in question, so suitable datasets The use of the NDVI would comprise direct II.
2. Research Design and Methods
must be available for the temporal approach to provide a complete inventory of all crops (Ozdogan et al., 2010).
RS studies of vegetation normally use specific wavelengths selected to provide information about the vegetation present in the area from which the radiance data emanated. These wavelength regions are selected because they provide a strong signal from the vegetation and also have a spectral contrast from most background resources (Tucker and Sellers, 1986). The wavelength region located in the VIS-NIR transition has been shown to have high information content for vegetation spectra (Collins, 1978;Horler et al., 1983;Broge and Leblanc, 2000). The spectral reflectance of vegetation in this region is characterized by very low reflectance in the red part of the spectrum followed by an abrupt increase in reflectance at 700-740 nm wavelengths (Broge and Leblanc, 2000). This spectral reflectance pattern of vegetation is generally referred to as the 'red edge'. The red edge position is likewise well correlated with biophysical parameters at the canopy level, but less sensitive to spectral noise caused by the soil background and by atmospheric effects Demetriades-Shah et al., 1990;Guyot et al., 1992;Mauser and Bach, 1994;Broge and Leblanc, 2000).
Leaf water content governs the reflectance properties beyond 1000 nm, but has practically no effect on the spectral properties in the VIS and NIR regions (Broge and Leblanc, 2000). In fact, chlorophyll concentration was sufficient to absorb nearly all of the blue and red radiation. Reflectance in the green (550 nm) and red-edge (715 nm) bands increase significantly as chlorophyll concentration decrease (Daughtry et al., 2000). Variations of leaf dry matter content affects canopy reflectance by increasing or decreasing the multiple intercellular scattering of the NIR rays. However, for practical RS applications, this effect can be assumed to be negligible, because within-crop variations of leaf dry matter content is very stable (Broge and Leblanc, 2000). Soil compaction negatively affects crop growth characteristics (Lowery and Schuler, 1991 The MODIS has been supplying a continuous data stream since 2000, lending to comprehensive time series analysis of the global terrestrial environment (Grogan and Fensholt, 2013). Of the available POES datasets, the MODIS reflectance products are favored among many in the research community with a focus on monitoring regional to global vegetation dynamics. The MODIS has a number of advantages when compared to other moderate-to-course resolution sensors, including superior spatial resolution, a broad spectral range (visible to mid-infrared), and superior geolocational accuracy (Wolfe et
3. III.
4. Results
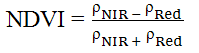
The vegetation phenology is important for predicting ecosystem carbon, nitrogen, and water fluxes (Baldocchi et The NDVI has been widely used for vegetation monitoring primarily for its simplicity. It is conceived as the normalized difference between the minimum peak of reflectance in the red wavelength and the maximum reflectance in the NIR domain: the higher the index value the better the vegetation conditions in terms of both biomass amount and vegetation health (Daughtry et al., 2000;Haboudane et al., 2002;Stroppiana et al., 2006).
Vegetation extraction from satellite imagery is the process of extracting vegetation information by interpreting satellite images based on the interpretation elements and association information (Xie, 2008 2.
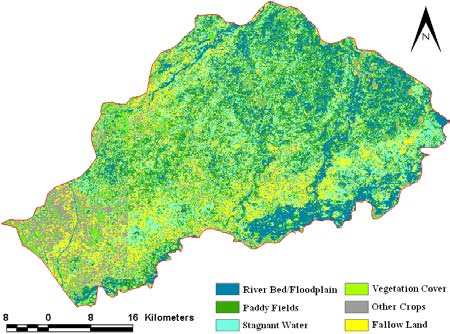
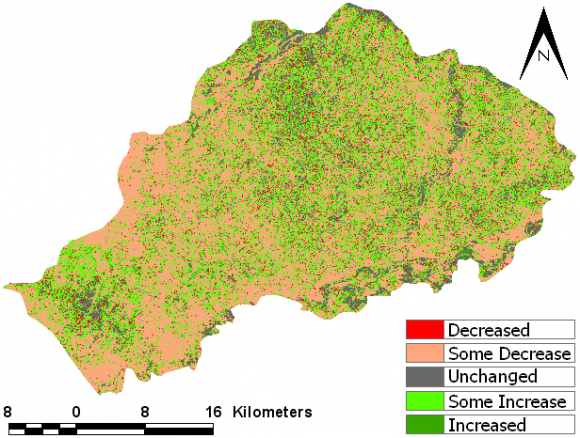
Figure 5 shows classified NDVI 2010, Narowal. After rectification, the NDVI model was applied upon Landsat TM image acquired on 2 nd November, 2010. ArcGIS symbology tool was used to develop NDVI classes and recognize the paddy cropped areas in Narowal. Maximum NDVI, minimum NDVI, mean NDVI and standard deviation is given in Table 2. Figure 8 shows image difference or change detection (2001-2010) at Narowal. The findings showed that decreased was 1254.83 km 2 (48.73%), some decrease 840.27 km 2 (32.64%), unchanged was 133.95 km 2 (5.20%), some increase 336.37 km 2 (13.06%) while increased was 9.58 km 2 (0.37%). Decreased and some decrease in vegetation cover was much higher as compared to some increase and increased. Accuracy assessment is given in the Table 5.
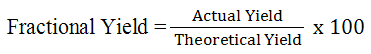
Detection of change is the measure of the distinct data framework and thematic change information that can direct to more tangible insights into underlying process involving land cover and land-use changes (Singh et al., 2013;. Monitoring the locations and distributions of land cover changes is important for establishing links between policy decisions, regulatory actions and subsequent land-use activities (Lunetta et al., 2006; Volume XIV Issue VI Version I 6; Figure 21) to investigate the general trend. Linear forecast trendline showed that fractional yield at Naina Kot was smooth during the entire period. The findings showed that January 2003 was the driest month during the entire period; February 2000 to February 2013. Heavy amount of fertilizer was used for crop growth and soil productivity.
IV.
5. Discussion and Conclusions
RS datasets and techniques have already proven to be relevant to many requirements of crop inventory and monitoring (Haboudane et al., 2002). At the present, there is an increased interest in precision farming and the development of smart systems for agricultural resource management; these relatively new approaches aim to increase the productivity, optimize the profitability, and protect the environment. In this context, image-based RS technology is seen as a key tool to provide valuable information that is still lacking or inappropriate to the achievement of sustainable and efficient agricultural practices (Moran et al., 1997;Daughtry et al., 2000;Haboudane et al., 2002).
RS provides a key means of measuring and monitoring phenology at continental to global scales and vegetation indices derived from satellite data are now commonly used for this purpose (Nightingale et al., 2008;Tan et al., 2008;Ahmad, 2012a;2012f). The study also identified several data acquisition and processing issues that warrant further investigation. Studies are under way to assess the importance of coordinating and timing field data collection and image acquisition dates as a means of improving the strength of the relationships between image and land condition trend analysis (Senseman et al., 1996;Ahmad, 2012c) ground-truth data. Recent literature has shown that the narrow bands may be crucial for providing additional information with significant improvements over broad bands in quantifying biophysical characteristics of paddy/rice crop (Thenkabail et al., 2000).
RS of agricultural resources is based on the measurement of the electromagnetic energy reflected or emitted from the Earth surface as a result of the energy matter interaction. RS data interpretation and processing aim to derive vegetation biophysical properties from its spectral properties (Stroppiana et al., 2006).
Spectral-based change detection techniques have tended to be performance limited in biologically complex ecosystems due, in larger part, to phenologyinduced errors (Lunetta et al., 2002;Lunetta et al., 2002a;Lunetta et al., 2006;). An important consideration for land cover change detection is the nominal temporal frequency of remote sensor data acquisitions required to adequately characterize change events (Lunetta et al., 2004;Lunetta et al., 2006;. Ecosystem-specific regeneration rates are important considerations for determining the required frequency of data collections to minimize errors. As part of the natural processes associated with vegetation dynamics, plants undergo intra-annual cycles. During different stages of vegetation growth, plants' structure and associated pigment assemblages can vary significantly (Lunetta et al., 2006;.
Validation is a key issue in RS based studies of phenology over large areas (Huete, 1999;Schwartz and Reed, 1999;Zhang et al., 2003;Ahmad, 2012d). While a variety of field programs for monitoring phenology have been initiated (Schwartz, 1999;Zhang et al., 2003;Ahmad, 2012d), these programs provide data that is typically specie-specific and which is collected at scales that are not compatible with coarse resolution RS observations.


| ; Sesnie et al., 2008; |
| Karaburun, 2010; Ahmad, 2012f; Ahmad and Shafique, |
| 2013a; Ahmad et al., 2013). |
| The NDVI is chlorophyll sensitive; the EVI (Liu |
| and Huete, 1995; |
| The MODIS (Terra) EVI/NDVI (MOD13Q1) data |
| products for research area were acquired, in this case |
| data were downloaded from the Land Processes |
| Distributed Active Archive Center (LPDAAC). Tile |
| number covering this area is h24v05, reprojected from |
| the Integerized Sinusoidal projection to a Geographic |
| Lat/Lon projection, and Datum WGS84 (GSFC/NASA, |
| 2003; Ahmad, 2012a; 2012b; Ahmad et al., 2013). A |
| gapless time series of MODIS (Terra) EVI/NDVI |
| composite raster data from February, 2000 to February, |
| 2013 with a spatial resolution of 250 m (Table 1) was |
| utilized for calculation of the rice fractional yield. The |
| datasets provide frequent information at the spatial |
| scale at which the majority of human-driven land cover |
| changes occur (Townshend and Justice, 1988; |
| Verbesselt et al., 2010; Ahmad, 2012a; Ahmad et al., |
| 2013). MODIS products are designed to provide |
| consistent spatial and temporal comparisons between |
| different global vegetation conditions that can be used |
| to monitor photosynthetic activity and forecast crop |
| yields (Vazifedoust et al., 2009; Cheng and Wu, 2011; |
| Ahmad et al., 2013). Details documenting the MODIS |
| (Terra) EVI/NDVI compositing process and Quality |
| Assessment Science Data Sets can be found at NASA's |
| MODIS web site (MODIS, 1999; USGS, 2008; Ahmad et |
| al., 2013). This study explored the suitability of the |
| MODIS (Terra) EVI/NDVI (MOD13Q1) pixels obtained |
| from a paddy/rice cultivated area, Naina Kot over |
| thirteen years (February, 2000 to February, 2013), to |
| explore rice fractional yield (Mulianga et al., 2013). |
| The application of the NDVI (Rouse et al., 1973; |
| Tucker, 1979; Ahmad, 2012a) in ecological studies has |
| enabled quantification and mapping of green vegetation |
| with the goal of estimating above ground net primary |
| productivity and other landscape-level fluxes (Wang et |
| al., 2003; Pettorelli et al., 2005; Aguilar et al., 2012; |
| Ahmad, 2012a). |
| Image Acquisition Date | Maximum NDVI | Minimum NDVI Mean NDVI | Standard Deviation | |
| 30 th September, 2001 (Landsat ETM+) | 0.56 | -0.42 | 0.05 | 0.11 |
| 2 nd November, 2010 (Landsat TM) | 0.65 | -0.40 | 0.13 | 0.11 |
| Image Acquisition Date | Classes | Area (km 2 ) | Area (%) | Accuracy Assessment (%) | |
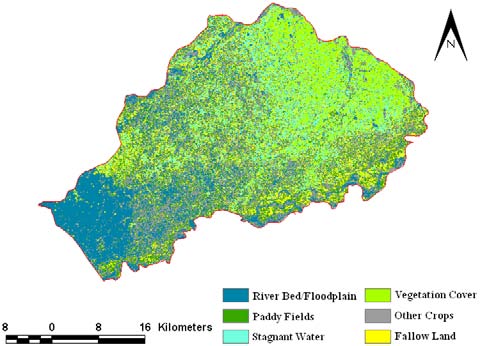
| River Bed/Floodplain | 498.69 | 19.37 | 87.42 | ||
| Paddy Fields | 430.88 | 16.73 | 85.44 | ||
| 30 th September, 2001 (Landsat ETM+) | Stagnant Water Vegetation Cover Other Crops | 382.97 294.12 565.24 | 14.87 11.42 21.95 | 87.08 88.45 92.20 | |
| Fallow Land | 403.10 | 15.66 | 87.29 | ||
| SUM | 2575 | 100 | - | ||
| Figure 6 shows supervised classification 2001, | of 565.24 km 2 (21.95%). Accuracy assessment is given | ||||
| Narowal. The classification was applied upon Landsat | in the | ||||
| ETM+ image acquired on 30 th September, 2001. The | |||||
| findings showed that the river bed/floodplain covered | |||||
| the area of 498.69 km 2 (19.37%), paddy fields 430.88 | |||||
| vegetation cover 294.12 km 2 (11.42%), fallow land | |||||
| 403.10 km 2 (15.66%) while other crops covered the area | |||||
| Year 2014 |
| 42 |
| ( B ) |
| Global Journal of Human Social Science |
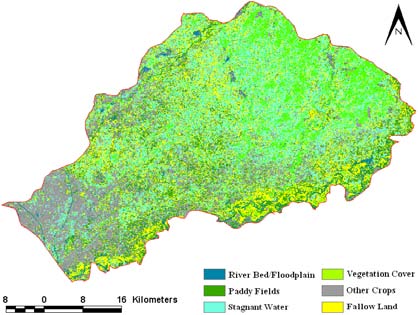
| Image Acquisition Date | Classes | Area (km 2 ) | Area (%) | Accuracy Assessment (%) |
| River Bed/Floodplain | 481.90 | 18.71 | 87.02 | |
| Paddy Fields | 400.14 | 15.53 | 88.04 | |
| 2 nd November, 2010 (Landsat TM) | Stagnant Water Vegetation Cover Other Crops | 359.31 320.48 467.01 | 13.95 12.45 18.14 | 92.04 85.42 90.20 |
| Fallow Land | 546.16 | 21.22 | 87.09 | |
| SUM | 2575 | 100 | - |
| During 2001 to 2010 | |||
| Classes | Area (km 2 ) | Area (%) | Accuracy Assessment |
| (%) | |||
| Decreased | 1254.83 | 48.73 | 87.31 |
| Some Decrease | 840.27 | 32.64 | 90.19 |
| Unchanged | 133.95 | 5.20 | 87.22 |
| Some Increase | 336.37 | 13.06 | 85.79 |
| Increased | 9.58 | 0.37 | 92.14 |
| SUM | 2575 | 100 | - |
| Image | EVI | NDVI | Fractional | Image | EVI | NDVI | Fractional |
| Acquisition | Pixel | Pixel | Yield | Acquisition | Pixel | Pixel | Yield |
| (Month/Year) | Value | Value | (%) | (Month/Year) | Value | Value | (%) |
| Feb. 2000 | 3524 | 8008 | 44.01 | Feb. 2007 | 4061 | 7586 | 53.53 |
| May 2000 | 1775 | 2289 | 77.54 | May 2007 | 1590 | 2557 | 62.18 |
| Aug. 2000 | 3516 | 7839 | 44.85 | Aug. 2007 | 4531 | 7971 | 56.84 |
| Nov. 2000 | 1411 | 2874 | 49.10 | Nov. 2007 | 1585 | 3025 | 52.40 |
| Feb. 2001 | 2363 | 6118 | 38.62 | Feb. 2008 | 3564 | 7055 | 50.52 |
| May 2001 | 1677 | 2332 | 71.91 | May 2008 | 1602 | 2447 | 65.47 |
| Aug. 2001 | 3847 | 6021 | 63.89 | Aug. 2008 | 2607 | 7832 | 33.29 |
| Nov. 2001 | 1687 | 3317 | 50.86 | Nov. 2008 | 1984 | 3079 | 64.44 |
| Feb. 2002 | 3415 | 6524 | 52.35 | Feb. 2009 | 4595 | 6857 | 67.01 |
| May 2002 | 1782 | 1957 | 91.06 | May 2009 | 1491 | 2121 | 70.30 |
| Aug. 2002 | 3988 | 7373 | 54.09 | Aug. 2009 | 4786 | 7202 | 66.45 |
| Nov. 2002 | 1904 | 3596 | 52.95 | Nov. 2009 | 1485 | 3416 | 43.47 |
| Feb. 2003 | 3506 | 7671 | 45.70 | Feb. 2010 | 3510 | 6422 | 54.66 |
| May 2003 | 1669 | 1707 | 98.12 | May 2010 | 1205 | 2068 | 58.27 |
| Aug. 2003 | 4981 | 8101 | 61.49 | Aug. 2010 | 4740 | 7610 | 62.29 |
| Nov. 2003 | 1699 | 3922 | 43.32 | Nov. 2010 | 1816 | 3405 | 53.33 |
| Feb. 2004 | 4858 | 7968 | 60.97 | Feb. 2011 | 3994 | 6968 | 57.32 |
| May 2004 | 2133 | 1792 | 119.03 | May 2011 | 1602 | 1961 | 81.70 |
| Aug. 2004 | 4214 | 8057 | 52.30 | Aug. 2011 | 2929 | 7303 | 40.08 |
| Nov. 2004 | 1937 | 4090 | 47.36 | Nov. 2011 | 1951 | 3409 | 57.23 |
| Feb. 2005 | 2863 | 7701 | 37.18 | Feb. 2012 | 3559 | 5639 | 63.11 |
| May 2005 | 1684 | 2324 | 61.82 | May 2012 | 1206 | 2283 | 52.83 |
| Aug. 2005 | 3252 | 7920 | 41.06 | Aug. 2012 | 4804 | 7263 | 66.14 |
| Nov. 2005 | 1497 | 3240 | 46.20 | Nov. 2012 | 1500 | 3205 | 46.80 |
| Feb. 2006 | 3481 | 7309 | 47.63 | Feb. 2013 | 3576 | 6584 | 54.31 |
| May 2006 | 1578 | 2434 | 64.83 | ||||
| Aug. 2006 | 2441 | 7710 | 31.66 | ||||
| Nov. 2006 | 1907 | 3292 | 57.93 |