1. Introduction
uring the last 80 years, the Kinneret Drainage Basin ecosystem has undergone anthropogenic and natural modifications. Before the 1950s, the Hula Valley was mostly (6500 ha) covered by old Lake Hula (1300 ha) and swampy wetlands. This area was not cultivated. Old Lake Hula and swamps were drained and were being converted for agricultural development. Years later, land utilization was modified in operation referred to as the Hula Reclamation Project (HRP). Regimes of nutrient inputs into Lake Kinneret were changed mostly by a decline in Nitrogen influx. Before the drainage of old Lake Hula and adjacent swamps (1950)(1951)(1952)(1953)(1954)(1955)(1956)(1957), Nitrogen contribution of the basin to the lake was mostly highly bio-available Ammonia. After the Hula drainage the dominant N was modified to Nitrate. Moreover, before the mid-1990s, a daily volume of 25 X 10 3 m 3 of raw sewage and Fishpond (1700 ha) effluents were influxed into Lake Kinneret. Later on, the fishpond area was dramatically reduced (450 ha), as well as their effluents, and the raw sewage was stored in reservoirs and reused.
The Jordan River crossing the Hula Valley contributes about 65% of the downstream of Lake Kinneret's water budget, source of 70% of the total nutrient inputs into Lake Kinneret, of which 50% originates in the Hula Valley region. The Hula Valley region includes the valley and the slopes on both sides (East and West mountain ridges) of it.
During 40 years after the Hula Valley drainage, the area was successfully cultivated, agricultural products were economically produced, and the nutrient flux into Lake Kinneret did not threaten its water quality. Nevertheless, as a result of inappropriate irrigation and cultivation methods, the peat soil quality deteriorated by consolidation and destruction. It was accompanied by heavy dust storms, subsidence of soil surface, blocking of drainage canals, enhancement of underground fires, and outbreaks of rodent populations. These deteriorated processes caused severe damage to crops therefore 500 ha of the deteriorated land were ignored. A reclamation project (Hula Reclamation Project, HRP) was consequently implemented (Figure 1) (Gophen 1995(Gophen , 2003;;Gophen et al. 2001).
Desertification does not necessarily overlap with dryness. Desertification is a process of soil fertility decline as it occurs in the Hula Valley located in a region with an annual precipitation of 500-900 mm/y. As a result of desertification, crops in the Hula Valley declined about the decline of soil fertility although water supply was sufficient (no dryness). The HRP objective aimed at overcoming those obstacles considering the avoidance of conflict between agriculture, Kinneret's water quality protection, and nature conservation.
The construction of the Hula reclamation project (HRP) started late 1993 and was accomplished in 1999 (Gophen 1995Gophen 2003;Gophen 2015 b). It was aimed at reducing the nutrient fluxes from Hula soil while retaining the economic utilization of the land through a shift of 500 ha of it from conventional agriculture to eco-tourism (Gophen 2003; Gophen et al. 2003). This conceptual design is based on man-made changes and reconstruction of the hydrological drainage and water supply system in the entire valley. The program's main objectives were: maintaining economically viable agriculture and eco-tourism, preventing pollutant inputs from reaching Lake Kinneret, and conservation of the region's unique and fragile ecosystem ; Gophen 2016 c; Gophen 2017).
During the construction of HRP, an onwards monitoring program was carried out (Barnea 2007(Barnea -2018; Gophen 1995 covering aspects of the ecology, agricultural and Touristic maintenance, water quality and flow regime as well as water budget and D water level of Lake Agmon-Hula and the discharge in the drainage canals, terrestrial and aquatic plants, underground water levels, Cranes and touristic visitors enumeration. This paper considers two periodical perspectives:
A: The short-term (1999-2018) view, started immediately after HRP accomplishment-aimed at exploring Nutrient migrations shortly after the newly structured hydrological system was completed.
2. B:
The long-term ) perspective aimed at exploring the role of environmental conditions and HRP on nutrient migration.
3. II.
4. Methods
The following data records accepted from Data Base centers and Interim reports were evaluated in this paper: Lake Kinneret- Givati 1970Givati -2016;;Gophen 1983Gophen ,1984;;Gophen 1995KLDB 1970KLDB -2018;;Mekorot 1970Mekorot -2018;;Meron et al. 2002Meron et al. -2018;;Peres 1940Peres -2018;;Rom 2001). Data taken from these records were evaluated using the following statistical methods: Simple Averages, Linear Correlation, and Fractional Polynomial. The evaluated discussion is divided between two periods: short (1999-2018) and long (1969-2018) terms.
5. a) Short Term (1999-2018) Perspective
6. i. HRP impacts on the Hula Valley ecosystem
Data record (1999-2018) indicated several positive developments in the Hula Valley: economically viable agriculture had been reestablished in spite of water scarcity; eco-tourism has been successfully implemented, particularly in Lake Agmon, and stringent regulations of public visits are in place; the levels of pollutant flux flowing from Lake Agmon into Lake Kinneret were found to be minor, and the arrival of numerous bird flocks (mostly Cranes, Pelicans, Cormorant, Herons, Ibis, Kites and Storks) to the Hula area are attracting large numbers of visitors, generating income for the landowners (Gophen et al. 2001(Gophen et al. , 2003(Gophen et al. , 2016;;Gophen 2003Gophen , 2015 a,b,c; a,b,c;. The HRP is an example of a constructed wetland which includes the anthropogenic introduction of natural components combined with reconstruction of water canals and the newly created Lake Agmon. The conceptual objective of an optimal system structure included un-interfered existence within a combination of renewed nature and anthropogenic intervention. The maintenance of this agro-ecological system depends upon the cooperation between farming, nature conservation and, water quality protection efforts.
The HRP was proposed at the end of the 1980s, then implemented and accomplished during 1994-2005. The project's objectives were aimed at improvement of three major aspects of Hula Valley hydrological regime: 1) elevation of the underground water table (GWT) level, 2) ensuring an undisturbed runoff flows in the 90 Km's of open canal for the supply of agricultural irrigation and GWT consumption, and 3) nutrients removal combined with appropriate management of Lake Agmon, and the migrating bird flock attractions. Analysis of the impact of climate change causing long-term dryness (Rain gauge decline Started mid-1990`s) trend with five years (2014-2018) of extreme dryness will be discussed.
The correlation between the Jordan River's yearly water yields (10 6 m 3 /y) and annual means of nutrient concentrations during 1999-2018 is given in Table 1. : Results of Linear Regression ( r 2 ; p) between annual Jordan (Huri Bridge) water yields (10 6 m 3 /y) and the annual total average of Nitrogen and Phosphorus species concentrations (ppm) in Jordan waters during 1999-2018 (through August). Significance (S=Significant; NS=Not Significant) level is indicated.
7. Table 2
It is better presented in Table 3 where the Jordan discharge enhancement in winter is clearly shown and significantly correlated with the increase of NO3 concentration. The monthly regime represents higher NO3 and obviously TN concentration during the winter months when discharge is higher and vice versa (Table 3). Conclusively, the River Jordan's discharge regime is positively correlated with NO 3 and Organic-N inputs while Phosphorus influxes are probably affected by other additional factors. It is, therefore, suggested that the decline of Nitrogen (mostly Organic) input to Lake Kinneret is due to long-term rain reduction (drought). It is suggested that the reduction in Organic Nitrogen inputs partly induced the ecological changes in the Kinneret ecosystem. The followings are the factors that represent the long-term ecosystem changes in Lake Kinneret: the drought consequences of Nitrogen decline and Phosphorus enhancement.
8. Table 3
The seasonal regime of the Jordan River discharge is crucial for the analysis of the drainage basin nutrient input dynamics into the lake. If nutrient fluxes would be totally discharge-dependent, the outcome is a reduction of all nutrients in summer. Nevertheless, results shown in tables 1 and 2 emphasize the difference between Nitrogen and Phosphorus compounds.
The next step would be to define fluctuations in the annual and monthly Jordan discharges (Table 4). Considering total Jordan River Yield below 270 (<270) mcm/y as drought condition (regime), the data are given in Table 4 indicates eight years (2018 included) of that definition. Until 2014 these dry years were not consecutive. The consequence of 5 years of drought during 2014-2018 caused ecological and national water supply difficulties.
The annual averages of N & P nutrient concentrations measured at Huri Bridge Station during 1999-2018 (Tables 5,6) indicate different temporal fluctuations. All N forms represented temporal elevation: TN-8.5%; TDN-14% from 2010; Organic-N-47%; Ammonium-7%; Kjeldhal Total-29% and Kijeldhal Dissolved-21% from 2005. On the contrary, the P nutrients represented a temporal decline: TP-14% from 2005; P-Ortho-25%; TDP-23% until 2012. As a result of those temporal changes of N & P concentrations in Jordan waters, the mass ratio of TN/TP slightly increased from about 10 to 24 and was below 24 throughout the entire period (1999-2018) except 30.2 in 2004 and 31 in 2015. The low ratio indicates a negative impact on the Kinneret water quality due to encouraging Cyanophytes proliferation. Due to the important role of Lake Agmon in the hydrological system in the Hula Valley, the next step would be to explore Nutrients Dynamic in Lake Agmon.
The Nutrient Balances in Lake Agmon would give an insight into its function as nutrients removal and contribution to the River Jordan loads within the entire Hydrological system (Table 7).
9. Table 7
Results in Table 7 indicate the efficient removal of Nitrogen as TN, TDN, NO3, and NH4 from the Lake Agmon out-flux. For Nitrogen, the Agmon removal activity is carried out. The Nitrogen removal (input >output) and consequently elimination from the River Jordan loads is probably carried out by De-Nitrification and sedimentation. On the contrary, Phosphorus (TP) balance is of contribution type (input<output) due to submerged plant P mediated: P from the sediments incorporated into the plant tissue and released into the water. P accumulated in bottom sediments by sedimentation of suspended particles and incorporated by submerged aquatic plants growth (spring-summer), which decomposed later during late summer-fall months. The disintegrated plant matter is drifted through the Agmon outflow.
The multiannual (2000-2005) averages of annually removed nutrient loads through Agmon outflow from Lake Kinneret indicated the following: TP -1.1 t/y; TN -34.7 t/y; NO3 -16 t/y; NH4 -5.4 t/y; Conclusively, the Phosphorus and Nitrogen removal through the Agmon system from total loads in the River Jordan that continue further into Lake Kinneret in % is minor: TP-2.0 % and 4% of TN. Temporal (annual and seasonal) fluctuations indicate a direct relation between Nitrate concentration in Lake Agmon and its outflows, as well as in Jordan waters: heavy precipitations induce intensive nitrate flushing from the Organic-Peaty soil of the Hula Valley into the water flows.
Nevertheless, during water migration in the underground (GWT), intensive De-nitrification process modifies nitrates to ammonium and free nitrogen volatile gases by de-nitrification. Not like Nitrogen, Phosphorus (TP) represents high concentrations during low precipitation regimes (seasonally and annually). It is probably caused by linkage brake-down enhancement between P and organic compounds under a low moisture regime. Conclusively, two factors might enhance P loads in the River Jordan flow: Discharge yield enhancement and Qualitative-dryness impact. Sulfate-Carbonate association and the production of Gypsum (CaSO 4 ) in Lake Agmon highlight the sink property of SO4 in the Agmon system while excess Sulfate removal (~1300 t/y) from the River Jordan flow (13-15%) is significant. The range of sulfate concentration in the River Jordan waters is 20-30 ppm, and the annual load (dependent on discharge) varies between 8500-10050 t. Consequently, the range of Sulfate removal through the Agmon system is 13-15% of the total Kinneret input. Not like P and N nutrients, Sulfate might be beneficial within the biochemical processes. The anoxic Hypolimnion include a high concentration of Sulfide, which is oxidized by bacteria during fall-early-winter of the De-Stratification process, a microbial activity that requires dissolved organic Three principal objectives were included within the proposal of Lake Agmon creation: nutrient collectors, maintenance of appropriate GWT and ecotouristic attraction.
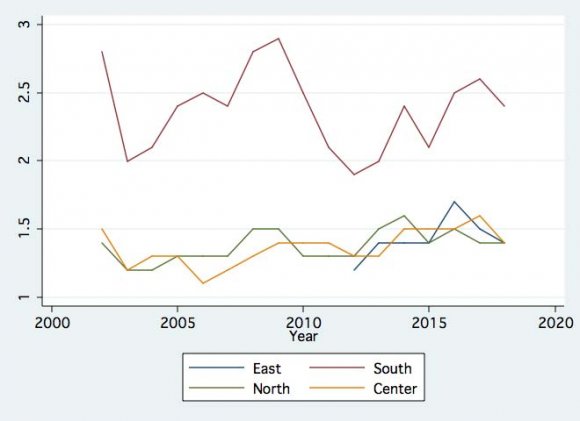
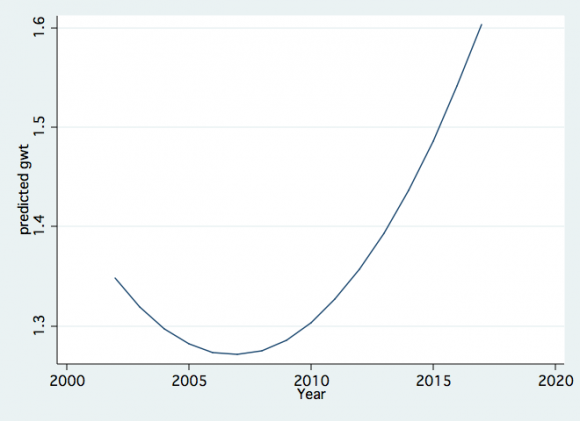
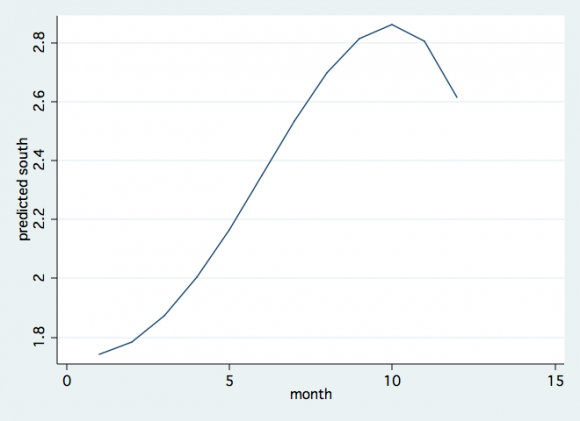
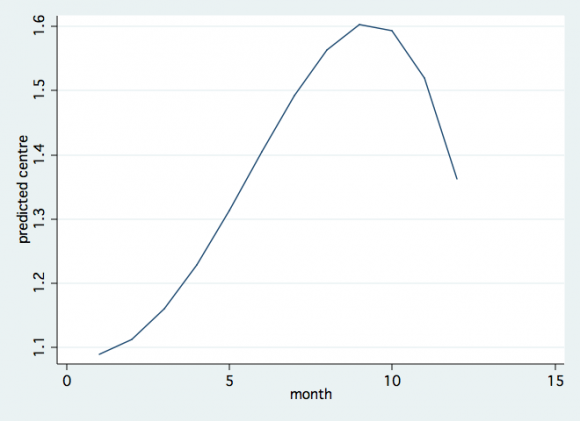
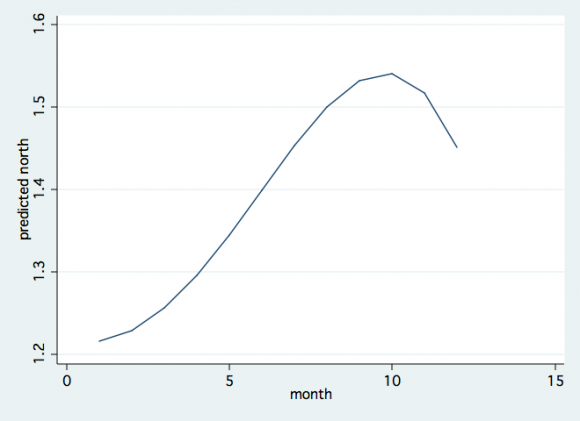
Lake Agmon is part of a hydrological system including runoff waters within open canals, GWT and preferential pathway capacities. Therefore, open canal runoff waters, WL in Lake Agmon and the GWT depths (Bore-holes, drill, distribution map in Figure 1) are physically correlated. Consequently, the Lake Agmon inflows through open canals affect GWT and underground migration of water and nutrients. The level of GWT in the northern part of the valley (northern to the Plastic Barrier: 1.2-1.5 m below surface) is significantly higher than in the southern part (2-3m below the surface), creating a Hydrological gradient from North to South (Figure 2). Moreover, temporal changes of GWT depths (Figure 3) were higher during 2002-2010 and then declined significantly by about 0.35 m Seasonal fluctuations. Further on, during September-December, there was no precipitation and irrigation GWT declined. The close relation between Agmon WL and GWT depth is shown in Figure 7 as well as temporally presented in Figure 8, with an increase during the winter months. Considering the major nutrient (SO4, TN, and TP) concentrations (Table 8) fluxing into Lake Agmon through major sources and their annual water inflow of 1.9, 7.0, and 0.5 X10 6 m 3 of RJ, CZ and HE, respectively, the annual load inputs are given in Table 9. Two major lines of nutrient-rich running water: Canal Z (previously 101) and Hula East. Canal Z is the major flushed nutrients collector from the northern organic soil blocks. Hula East Canal collects nutrients from the eastern peat soil blocks. According to annual reports the Hula East contribution is minor due to low discharges, whilst most of the nutrient inputs into the Agmon are supplied by Canal Z. The ranges of annual (1999-2005) water inflows to Lake Agmon varied between 1.9-4.98 X10 6 m 3 , 1.5-7.75 X10 6 m 3 , and 0.43-1.24 X10 6 m 3 , through Reconstructed Jordan, Canal Z and Canal Hula-East, respectively. The annual (1994)(1995)(1996)(1997)(1998)(1999)(2000)(2001)(2002) means (SD) of nutrient inputs into Lake Agmon through the Reconstructed Jordan (RJ), Canal Z (CZ) and Canal Hula East (HE) are given in Table 8. Results given in Tables 8 & 9 indicate lower concentrations and loads in the Reconstructed Jordan waters inflows and high concentrations of Nitrogen and Phosphorus compounds, which are fluxed from the major Northern-Central-Eastern block of organic peaty soils and conveyed into Lake Agmon. Nevertheless, a significant part of the Nitrogen matters are removed by de-nitrification and sedimentation in Lake Agmon. The Sulfate is partly precipitated as Gypsum accumulating within the Agmon sediments while the rest is removed outside the Basin. The rest of the Sulfate is fluxed into Lake Kinneret, probably not causing damage to the water quality. Conclusively, quantitative indication of the Lake Agmon Hydrological System contribution aimed at Kinneret water quality protection is not highly significant. Nevertheless, it was found that the nutrients included in the Canal runoffs (CZ, HE) are only partial of the total nutrient migrations in the Hula Valley. The dynamics of the GWL depth combined with Lake Agmon Water Level (WL) are related to the underground nutrients migration dynamics in the Hula Valley.
Earlier studies documented two underground aquifers: 1) The shallower aquifer stretched between the soil surface and 10-15 meters. Cracks, tunnels and irregular free spaces forming preferential water pathways in this layer caused by dryness, low soil moisture or low wetness due to water scarcity (drought) as rain declines, limited supplied irrigation water. 2) Deeper water storage at depths of ten to hundred and even thousand meters. The properties (chemical composition, quantities, dynamics) of the deeper water storage, termed as "lignite waters", is very little known. No evidence was approved for mass water exchange between the deeper and the shallow storages . Moreover, it is suggested that lignite waters do not have an impact on the quality of runoffs or other bodies of water on the surface. The existence of the contact phase and mass exchange between the two layers was not approved. Boreholes and deeply drilled pumping of lignite waters indicated un-aerobiosis conditions and high concentrations of NH4 and TP.
10. b) Long-term (1970-2018) perspective
Climate Change (Gophen 2014; 2016,b; 2018; Peres 2018) Consideration is required to distinguish between two ecological processes affected by climate conditions: Desertification and Dryness. Desertification regarding the decline of soil fertility (and not necessarily water scarcity) and dryness significance is precipitations decline. In the case of nutrient inputs from the basin into Lake Kinneret, the dominant controlling aspect is due to dryness (Hydrological regime). The river discharge modifications are part of climate change which includes several other parameters such as temperature. Previous studies suggested a link between plant cover caused by agricultural development and other anthropogenic alterations and air temperature as part of ALBEDO mechanism. Therefore, a comprehensive approach for the analysis of Kinneret Basin-Lake relationships is required. Air Temperature fluctuations in the Hula Valley are given in Table 10.
Table 10 As based on the long-term record of precipitation in Kfar Giladi (northern valley region), the Standard Precipitation Index (SPI) was computed, and results given as four Drought levels (Givati 2016, unpublished data) are presented in Table 11. Results in Table 11 indicate a higher occurrence of drought conditions during 1930-1980 than the later period (1981-2014): A+B was 60% and 39% before and after 1980, respectively. The decline of precipitations since the 1990s (Figure 7) was obviously accompanied by the reduction of rivers discharges in the Kinneret Drainage Basin. (Givati 2016) (Figure 9) (Gophen 2017;2018). The total area of the Kinneret Drainage Basin is 2730 km 2 of which the Hula Valley is only 7% by area but much more by its role as a nutrient source. Those chemical compounds are mostly soil-born traits which are suggested to affect the water quality of the downstream Lake Kinneret. Consequently, the Lake Kinneret water quality is supposed to be, at least, partly Hula Valley-dependent. These concerns motivated managers of water and agricultural policy to design and implement, in the Hula Valley, protective management on the Kinneret services quality, including water supply, recreation, fishery, and tourism. Two major constraints directed the implementation of this proposal: Ecological Services to be supplied by Lake Kinneret and the income resources proposed for the new settlements establishment. Newly immigrated citizens populating required agricultural income resources development for them combined with the protection of Kinneret Water Quality. A lot of financial resources were invested in the implementation of several multidisciplinary complicated projects, and the time has come to define the welfare merits produced by the ecological implementations. The nutrients flux from the Hula Valley downstream into Lake Kinneret is highly related to the history of land use policy of the Hula land. The Hula Valley Land utilization before drainage (before the 1950's) was extensive and later became intensive. Population size in the Kinneret basin increased from about 2000 during the 18 th -19 th centuries to presently above 250,000 residents. The population size and agricultural development increase resulted in significant enhancement of the production of fish breeding aquaculture effluents and wastewater (sewage) volume. Nevertheless, not only did humans or aquaculture enhance wastewater production, but also the Hula Valley (Old Lake Hula and swampy area) drainage, which was followed by agricultural cultivation, enhanced nutrient export fluxes. Moreover, due to an increased level of soil oxidation, the dominant form of nitrogen was changed from Ammonium before drainage to Nitrate after drainage. The water authorities' awareness of the need for Kinneret water quality protection initiated the anthropogenic intervention, which was supposed to reduce Nitrogen flux from the valley to the lake. The level of Nitrogen flux from the Hula Valley to Lake Kinneret gradually declined but probably mostly due to sewage removal and aquaculture restriction causing the point which altered nutrient trait in the Kinneret Epilimnion from Phosphorus to Nitrogen limitation. These were the principal modifications in the Hula Valley ecosystem which were followed by crucial modification of the Kinneret ecosystem. The nutrient dynamics of Lake Kinneret were modified from P to N limitation. The implication of such an ecological turnaround is crucial for water quality (Gophen 2015 b,c). The dominant Pyrrhophyte algae in Lake Kinneret, the bloom-forming Peridinium, were replaced by Cyanophyte dominance. How does such a fundamental exchange occur? In particular, what kinds of events are responsible for that modification? Undoubtedly restriction of Fish-Ponds from 1700 ha to 350 ha caused a significant reduction of waste effluents.
Similarly, sewage removal had the same impact, which reduced the flux of organic Nitrogen. Nevertheless, Nitrate inputs were not lowered. Consequently, significant sources of Nitrogen to the Kinneret Epilimnion are controlled by human activity (anthropogenic), such as Fishpond and sewage effluents. The soil cultivation born Nitrogen probably Water-Mediated Nutrients Export from the Hula Valley to Lake Kinneret: A Review
11. 33
migrates mostly downward and is stored in deep layers, and less is exported into the Lake Kinneret. Before the drainage 100% of the valley surface was covered permanently or partly (seasonally) by water, i.e., old Lake Hula, Swamps, and Seasonal floods, whilst currently only about 10% of the valley surface is watercovered (Lake Agmon and several smaller bodies of water), but 70% are covered by cultivated field crops and only 2% are not cultivated. The valley is fully greencovered throughout a full annual cycle. As a result of the HRP, the present control on nutrient fluxes is efficient and, field crops were highly improved. The Hula Valley drainage contributed remarkable improvement of infrastructure for local human residents' welfare.
Environmental conditions that presently exist in the Hula Valley justify the verdict of significant success of the anthropogenic intervention. Therefore, the fate of produced nutrients and the knowledge of their potential impact on the Kinneret waters are critical. Precipitation Impact on Nutrient flux (Levin 1970;Geifman 1981;Geifman et al. 1987) The contribution of Nitrates by the Hula Valley soils was studied separately during 1975-1981. A comparative Nitrate concentration monitoring program in the Jordan water was carried out. Water samples were simultaneously collected on a weekly basis in two stations and, Nitrate concentrations were analyzed. The location of these two stations were: 1) At the most northern end of the Hula Valley where the Jordan River flow gets into the Hula Valley (Josef Bridge) and 2) at the Huri Bridge Station, southern end of the Valley, the downstream continuation of the Jordan flows beyond all the Hula Valley canals. The Difference between those two stations is reflecting additional Nitrate contribution by the Hula Peat-Land. It was found that the difference in nitrate concentration between these two stations is influenced by precipitations: it is high (41% and 36%) in rainy months, January and February, respectively, and declines later on (17%) in March under lower precipitation regime (Table 12). The rainy waters are probably flushing and transporting Nitrates from their major source, the Hula Organic Peaty soil, through the Jordan into Lake Kinneret. The highest decline during 2000-2018 was due to Organic Nitrogen (72%), TN (47%), and TP (65%). Taking into account the significant impact (26.5%) of discharge on loads flux, the following decline (%) was considered: 45.5%, 38.5% and 20.5% decline of Organic Nitrogen, Total Phosphorus and Total Nitrogen, respectively. It is, therefore, suggested that the highest decline of Organic Nitrogen and TP were affected by anthropogenic operations of sewage and fish ponds effluents removal. It is, therefore, suggested that relevant parameters such as the impact of the Hula Water-Mediated Nutrients Export from the Hula Valley to Lake Kinneret: A Review quality is due to the anthropogenic operations of fishpond effluent and sewage removal.
Nevertheless, it is not impossible that the management improvement of the agricultural development (Hula Reclamation Project) of the Hula Valley Crops reduce the flux of TP from cultivated land. The agricultural management included elevation of GWT, green cover throughout a full annual cycle and the increase of soil moisture. Nevertheless, the impact of these improvements on TP transport was not so much implemented through the Lake Agmon system, which removed annually about 1 ton of TP only. The answer to the question about TP removal through other channels is yet unknown.
Periodical presentation of the impact of rain regime is given in Table 14. River Jordan annual loads measured at Huri Bridge during two consecutive periods: heavy rained (1968)(1969) and dry (1969-1970) (Table 14). The impact of heavy rain and high discharge (1099 10 6 m 3 /y) in 1968-69 in comparison with 1969-70 (571 10 6 m 3 /y) is clear. An Interim Report of Mekorot Water Supply Company (J. Geifman1981) has indicated that Nitrates measured at Huri Bridge and originated in the Hula Valley Organic Peat Soil comprised about 64% of total Nitrates measured there. It was also documented in this report that total Nitrate load measured at Huri Bridge Station (Southern Hula Valley Outlet point) comprised about 21-25% of the total Nitrogen (TN) that flux through that station downstream to Lake Kinneret.
12. c) Sewage Removal
It is suggested that the major impact on Nitrogen supply reduction from the Kinneret Drainage basin is mostly due to Fish pond cut down and sewage removal. As of the mid-1980s, sewage collecting reservoirs were constructed where more than 50% of the sewage was collected. Before that, about 6-7 million cubic meters of raw sewage fluxed into Lake Kinneret. An interim report published by the Mekorot Water Supply Company (Geifman et al. 1987) documented the significant reduction of Organic Nitrogen inputs. Geifman et al. (1987) also documented mean annual nutrient loadings from the total drainage Basin of which the Hula Valley comprised >50% as measured at the Huri Bridge sampling station (mean discharge 530 mcm/y) as follows:
TN -1584 t; TP -119t; SRP -14 t; Organic Nitrogen -480 t; Nitrate -1042t; Ammonium -63t. These quantities were significantly reduced. The cardinal curiosity is, what was the reason for those changes? Three major parameters are relevant: Agricultural tourism and Hydrological management, Climate Change as rain and river discharge fluctuations, sewage and fishpond effluents removal.
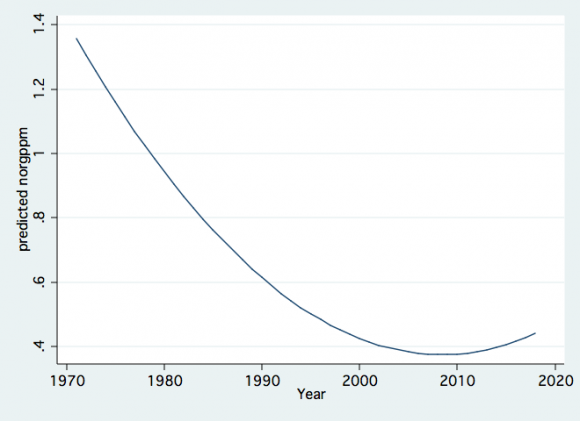
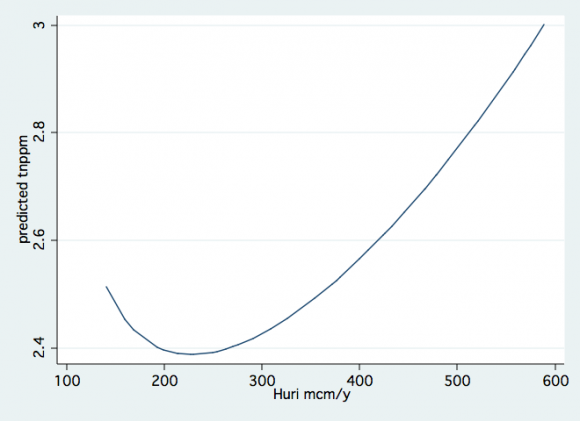
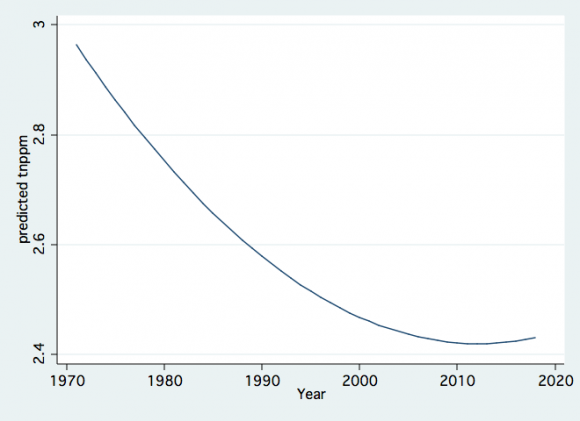
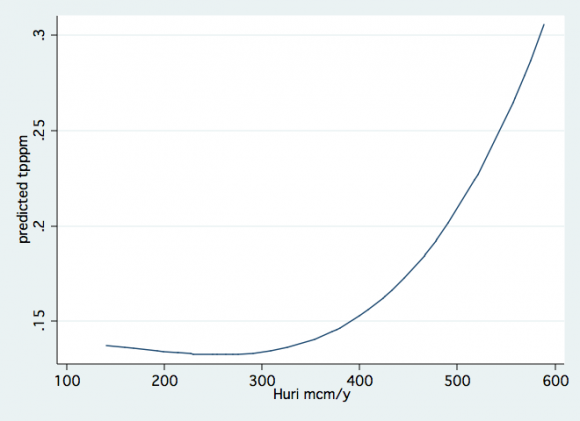
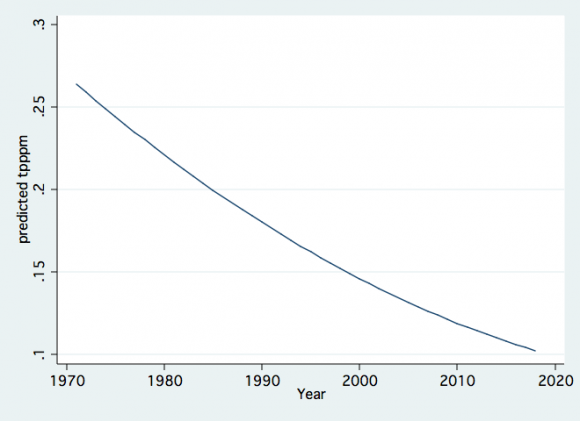
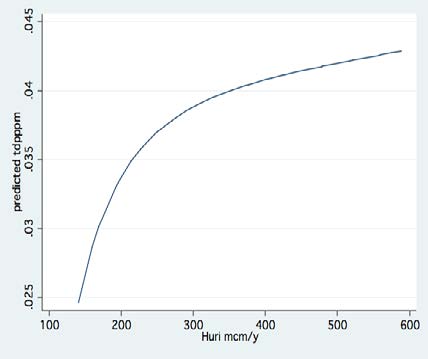
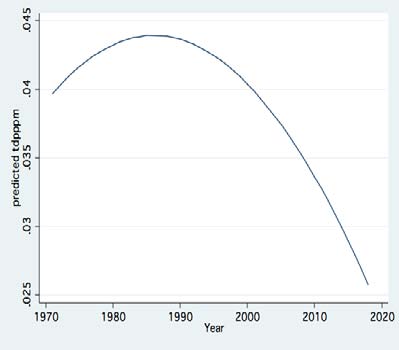
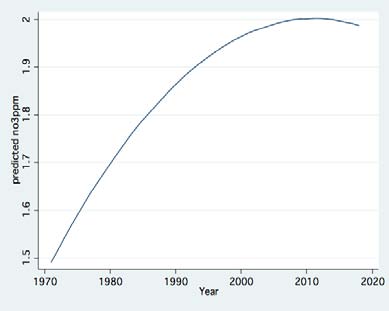
Linear regression computation between annual (1970-2018) means of nutrient concentrations (ppm) and, Jordan River Yearly discharges revealed the following results (Table 15). to the River water yield. Because a high level of correlation was found between Jordan discharge and nutrient concentrations and the river flow was reduced since the mid-1990s (Figure 9), the concentration decline with time is obvious ( Figures 10,11,12).
due to precipitation regime (Figure 9) and consequently
13. Year 2018
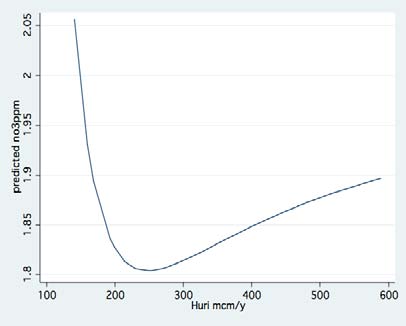
Water-Mediated Nutrients Export from the Hula Valley to Lake Kinneret: A Review Moreover, the relation between annual averages of nutrient concentration indicates a general pattern: concentration decline with discharge decline between 600 and 300 mcm/y (1970-2010) and concentration leveling or slight increase below 300 mcm/y. In other words, under a drought regime (<300 mcm/y) concentration does not fluctuate while they increase when the discharge is higher (>300mcm/y). During common rain gauge, higher nutrients are drifted and transported by water throughout the entire drainage basin including Hula land downstream into Lake Kinneret. During drought (<300mcm/y) less or no nutrient drifting and transportation is carried out, which resulted in very low fluctuations of concentration in the Jordan River.
Because rain gauge indicated a decline from the mid-1990's, a separate analysis was carried out from 2000 to 2018, which represents a drought regime. The values of Linear Regression between Jordan discharge and nutrient concentrations are given in Table 16.
Table 16 The information included in Table 16 represents mean Jordan yield of 307 mcm/y and five years (2014-2018) of extreme drought regime (160-227 mcm/y) during this period. All nutrients, excluding NO3 and NH4, represented significant relation with Jordan's annual water Yield. It is suggested that the non-linear relation trait of Ammonium and Nitrate is due to their nature of flushing mechanism: these nutrients are seasonally flushed by rain in winter and precipitation depletion disrupted their drifting process. Water loss under a drought regime was recently documented (Gophen 2018). Water loss causation is attributed to soil dryness enhancements of preferential rich nutrients' water flow spaces. It is, therefore, suggested as partial nutrient removal from the Kinneret inputs. d) Conclusive Remarks 1. Significant positive correlations were found between 2. Climatological conditions indicated a long-term decline of precipitation with eight years of droughts with five recent years in a row. 3. A reclamation project within the Hula Land was implemented which is concluded by a minor quantitative impact on nutrient export through the Lake Agmon hydrological system. Nitrogen and Phosphorus inputs into Lake Agmon are fluxed from the Organic Peat Soil during winter and summer, respectively. 4. The major impact on Peat soil sourcing of Nitrate water-mediated migration is winter precipitation. 5. Organic Nitrogen input originating from the drainage Basin significantly reduced mostly due to fishpond restrictions and sewage removal. Total Dissolved Phosphorus was also reduced but to a lesser extent caused by same developments as Nitrogen. 6. The Hula Reclamation Project (HRP) improved agricultural management in the Hula Valley but nutrient export from the Basin to Lake Kinneret was mostly affected by climate change (precipitation decline).
7. Future Perspectives: The Lake Kinneret ecosystem deserves a continuous and gradual increment of Epilimnetic Nitrogen, which is presently a factor of limitation. Potential sources of available Nitrogen are the Peat-Organic soil in the Hula Valley.
Nevertheless, an available Nitrogen source without transporting measures into Lake Kinneret for the improvement of Lake Kinneret's ecological services is not beneficial and, water mediation is the best "transportation service" for that mission. Moreover, GWT elevation combined with soil moisture increase by irrigation is ultimately required for the optimal maintenance of agricultural development. If climate change expressed as precipitation decline continues, the import of water from other sources to improve the Hula Valley's soil condition are recommended. Hydrological management proposition encourages a recommended integration between the two ecosystems, Lake Kinneret and the Hula Valley. Presently, the increase of salinity and lack of Nitrogen are the most acute conditional difficulties in Lake Kinneret annual averages the concentrations of TN, TP, NO3, TDP, NH4 and Kjeldhal dissolved and Jordan River Water Yields (mcm/y): The higher the yield is the higher are nutrient concentrations.
an operation is optimal accordingly: replacement of saline lake water by desalinated freshwaters. A multipurpose solution is suggested: import desalinated waters and export (possibly by pumping) lake water to the Hula Valley. Optimal agricultural development in the Hula Valley combined with salinity decline in Lake Kinneret are predicted as well as enrichment of Kinneret Epilimnetic Nitrogen originating in the Hula and transported to Lake Kinneret.

| : Monthly means of water flow (mcm/m; |
| 10 6 m 3 /month) measured in Huri Bridge Station during |
| 2000-2018 (2018 through August). (Data Source: |
| Mekorot Co. Ltd; LKDB 1970-2018). |
| : Annual averages of water discharge |
| (mcm/s) and annual total water yields (mcm/y) |
| measured in Huri Bridge Station during 2000-2018 |
| (2018 through August). (Data Source: Mekorot Co. Ltd; |
| LKDB 1970-2018). |
| Year | mcm/s | mcm/y |
| 2000 | 8.3 | 254 |
| 2001 | 6 | 199 |
| 2002 | 11.6 | 326 |
| 2003 | 26.3 | 807 |
| 2004 | 19.4 | 619 |
| 2005 | 13.7 | 446 |
| 2006 | 11.2 | 372 |
| 2007 | 11.3 | 354 |
| 2008 | 5.9 | 230 |
| 2009 | 10.5 | 263 |
| 2010 | 12.3 | 424 |
| 2011 | 13.3 | 426 |
| 2012 | 18.5 | 518 |
| 2013 | 14.6 | 521 |
| KIJD | KIJT | NO3 | N-Org | TDN | TN | NH4 | TN/TP | Year |
| 0.188 | 0.523 | 1.614 | 0.488 | 2.137 | 0.034 | 15.8 | 1999 | |
| 0.217 | 0.497 | 1.816 | 0.428 | 2.313 | 0.069 | 17.4 | 2000 | |
| 0.216 | 0.475 | 1.697 | 0.423 | 2.172 | 0.052 | 19.2 | 2001 | |
| 0.219 | 0.422 | 1.904 | 0.348 | 2.326 | 0.074 | 16.6 | 2002 | |
| 0.226 | 0.325 | 2.607 | 0.293 | 2.932 | 0.032 | 27.9 | 2003 | |
| 0.223 | 0.474 | 2.305 | 0.416 | 2.502 | 2.781 | 0.054 | 30.2 | 2004 |
| 0.294 | 0.417 | 1.880 | 0.352 | 2.200 | 2.302 | 0.061 | 25.6 | 2005 |
| 0.266 | 0.418 | 1.889 | 0.338 | 2.094 | 2.300 | 0.095 | 25.8 | 2006 |
| 0.194 | 0.374 | 1.927 | 0.336 | 2.002 | 2.266 | 0.060 | 20.1 | 2007 |
| 0.183 | 0.428 | 1.729 | 0.367 | 1.857 | 2.138 | 0.060 | 11.4 | 2008 |
| 0.182 | 0.347 | 2.060 | 0.306 | 2.092 | 2.290 | 0.048 | 21.4 | 2009 |
| 0.180 | 0.372 | 2.094 | 0.318 | 2.243 | 2.466 | 0.054 | 18.0 | 2010 |
| 0.212 | 0.367 | 2.016 | 0.344 | 2.172 | 2.359 | 0.051 | 17.3 | 2011 |
| 0.221 | 0.414 | 2.106 | 0.366 | 2.296 | 2.498 | 0.048 | 13.9 | 2012 |
| 0.239 | 0.405 | 2.175 | 0.351 | 2.336 | 2.515 | 0.057 | 22.9 | 2013 |
| 0.313 | 0.516 | 1.903 | 0.466 | 2.222 | 2.417 | 0.048 | 26.6 | 2014 |
| 0.239 | 0.535 | 2.068 | 0.476 | 2.308 | 2.603 | 0.059 | 31.0 | 2015 |
| Year 2018 |
| 25 |
| ( H ) |
| Global Journal of Human Social Science - |
| Nutrient | RJ | CZ | HE |
| SO4 | 25 (5) | 364 (343) | 739 (380) |
| TDS | 255 (51) | 941 (847) | 1482 (695) |
| N-NH4 | 0.05 (0.1) | 3.3 (4.9) | 1.2 (2.4) |
| N-NO3 | 1.2 (0.3) | 13.9 (22.7) | 3.2 (4.2) |
| TN | 2.0 (1.2) | 18.8 (27.0) | 6.4 (5.0) |
| TDN | 4.6 (7.4) | 1.8 (1.2) | 16.9 (24.8) |
| TP | 0.2 (0.1) | 0.1 (0.1) | 0.2 (0.2) |
| TDP | 0.02 (0.02) | 0.09 (0.2) | 0.1 (0.2) |
| Annual loads (t/y) of nutrient inputs |
| through major Agmon Inflow Sources RJ= Reconst- |
| ructed Jordan; CZ=Canal Z; HE=Canal Hula East) |
| during 2002. |
| Nutrient | RJ | CZ | HE |
| SO4 | 48 | 2548 | 370 |
| TN | 4 | 132 | 3 |
| TP | 0.4 | 0.7 | 0.1 |
| Period | Mean Air Temperature ( 0 C) |
| 1946-1958 | 20.2 |
| 1959-1982 | 19.4 |
| 1983-1990 | 18.9 |
| 1991-2008 | 19.8 |
| From 1970 to 2000, precipitation gauge in the |
| northern part of the Basin (Kfar Giladi Meteorological |
| Station) declined from 954 to 708 mm/y, and in Dafna |
| station (Eastern to Kfar Giladi) there has been a |
| decrease of approximately 120 mm/y since the early |
| 1990s. Two of the major headwaters, Rivers Dan and |
| Banias discharges, have been reduced by 23% and |
| 19%, respectively. The Mean discharge of the River |
| Jordan during 1970-1999 was 454 mcm/y and during |
| 1999-2018 -350 mcm/y (23% reduction). |
| : The periodical occurrence (%) of | ||
| Drought levels (A,B,C,D) computed by Standard | ||
| Precipitation Index (SPI) by Givati (2016,): A= Close to | ||
| Normal Conditions; B= Moderate Drought; C= Severe | ||
| (extreme) drought; D= Normal Conditions. (Data Source: | ||
| Givati 1970-2016; Un-published Data). | ||
| Drought Level | 1930-1980 | 1981-2014 |
| Period | Period | |
| A | 34 | 21 |
| B | 26 | 18 |
| C | 2 | 3 |
| D | 38 | 58 |
| Year | January Huri | January Josef | February Huri | February Josef | March Huri | March Josef | |
| 1975 | 1.3 | 1.28 | 1.77 | 1.49 | 1.56 | 1.23 | |
| 1976 | 1.47 | 1.4 | 1.38 | 1.3 | 1.45 | 1.18 | |
| 1977 | 1.9 | 1.41 | 1.88 | 1.18 | 1.43 | 1.18 | |
| 1978 | 2.15 | 1.28 | 1.74 | 1.16 | 1.43 | 0.99 | |
| 1979 | 1.45 | 1.4 | 1.57 | 1.23 | 1.43 | 1.19 | |
| 1980 | 2.61 | 1.58 | 2.25 | 1.18 | 3.68 | 1.21 | |
| 1981 | 4.71 | 1.57 | 4.49 | 1.35 | 2.2 | 1.11 | |
| Average | 2.23 | 1.42 | 2.15 | 1.27 - | 1.88 | 1.56 | |
| Results in Table 12 indicate a clear | |||||||
| enhancement of Nitrate flush and transport with | |||||||
| increasing precipitation regime and consequently River | |||||||
| Jordan discharge. Therefore, a brief comparative | |||||||
| summary of nutrients loads in those two periods, 1969- | |||||||
| 1985 and 2000-2018 are presented in Table 13. Mean | |||||||
| annual flow through Huri Bridge during 1969 -1985 was | |||||||
| 473 10 6 m 3 /y and during 2000-2018 was 350 10 6 m 3 /y | |||||||
| (26.5% decline). | |||||||
| Table 13: Averaged Nutrient loads (tons) fluxed | |||||||
| through Huri bridge during two periods: A= 1969-1985 | |||||||
| and B= 2000-2018; (Data Source: Geifman et al. 1987; | |||||||
| LKDB 1970 | 2018; Mekorot Water Supply Co. Ltd.). | ||||||
| Nutrient | 1969-1985 | 2000-2018 |
| NH4 | 63 | 42 |
| NO3 | 1042 | 967 |
| Organic- | 481 | 136 |
| N | ||
| TN | 1584 | 846 |
| SRP | 14 | 9.5 |
| TP | 120 | 42 |
| Nutrient | 1968-1969 | 1969-1970 |
| TP | 252 | 87 |
| TN | 4301 | 1259 |
| NO3 | 3352 | 906 |
| Dissolved Organic Nitrogen and NH4 | 949 | 353 |
| : Results of Linear Regressions (r 2 and | |||
| p values) values between annual (1970-2018 through | |||
| August) averages of nutrient concentrations (ppm) and | |||
| yearly Jordan Water Yields (<600 mcm=10 6 m 3 ) and the | |||
| water total inflow Vs years, as measured in the Huri | |||
| Bridge Sampling Station: S=Significant). (Data LKDB | |||
| 1970-2018; Mekorot Water Supply Co Ltd. Jordan | |||
| District Monitor Unit). | |||
| Nutrient | r 2 | p | Sinificance |
| TN | 0.1383 | 0.0046 | S |
| TP | 0.4599 | <0.0001 | S |
| NO3 | 0.2012 | 0.0029 | S |
| NH4 | 0.2527 | 0.0007 | S |
| N-Organic | 0.5984 | <0.0001 | S |
| TDP | 0.2019 | 0.0028 | S |
| Kjeldhal Total | 0.6586 | <0.0001 | S |
| Kjeldhal Dissolved | 0.6417 | <0.0001 | S |
| mcm/y | 0.2004 | 0.0030 | S |